 comparison
Peptide Purity Levels for Cell Culture Studies: A Review
Table of Contents
- Why Peptide Purity Matters in Cell Culture Studies
- HPLC Peptide Purity Analysis: How Purity Is Measured
- Purity Percentages and Quality Thresholds for Cell-Based Studies
- What a Peptide Certificate of Analysis Does and Does Not Tell You
- Peptide Identity Testing by Mass Spectrometry and Orthogonal Confirmation
- How Peptide Impurities in Cell Culture Affect Experimental Outcomes
- Lot-to-Lot Consistency, Reference Standards, and Documentation
- Conclusion
- Frequently Asked Questions
Last Updated: October 13, 2026
Why Peptide Purity Matters in Cell Culture Studies
Peptide purity levels for cell culture studies review is the practice of matching a compound's verified purity to the sensitivity of the biological system it will be tested in. At Bluegrass Research, we supply research-grade peptides with lot-specific, third-party analytical documentation, and a common question is simple: does the purity percentage on a certificate of analysis actually predict how a peptide will behave in culture? The honest answer is that it predicts some things well and other things not at all.
That gap matters because cell-based assays amplify whatever you put into them. A contaminant that is invisible in a buffer can shift viability, inflame a signaling readout, or introduce a variable you never accounted for. The FDA guidance on analytical procedures and methods validation frames the underlying principle: a method is only as trustworthy as the documentation behind it.
Below, we walk through how purity is measured, what the number excludes, and how to choose a threshold for your specific application.
HPLC Peptide Purity Analysis: How Purity Is Measured
HPLC peptide purity analysis measures purity by separating the components of a sample in a liquid stream and quantifying how much of the signal belongs to the target peptide. High-performance liquid chromatography, usually run in reverse-phase mode (RP-HPLC), is the standard method because peptides separate well on a hydrophobic stationary phase.
In practice, the peptide is dissolved, injected onto a column, and carried through by a gradient of increasing organic solvent. Different molecules travel at different speeds depending on how hydrophobic they are. A detector, typically UV absorbance, records everything that elutes. The result is a chromatogram: a series of peaks plotted against time.
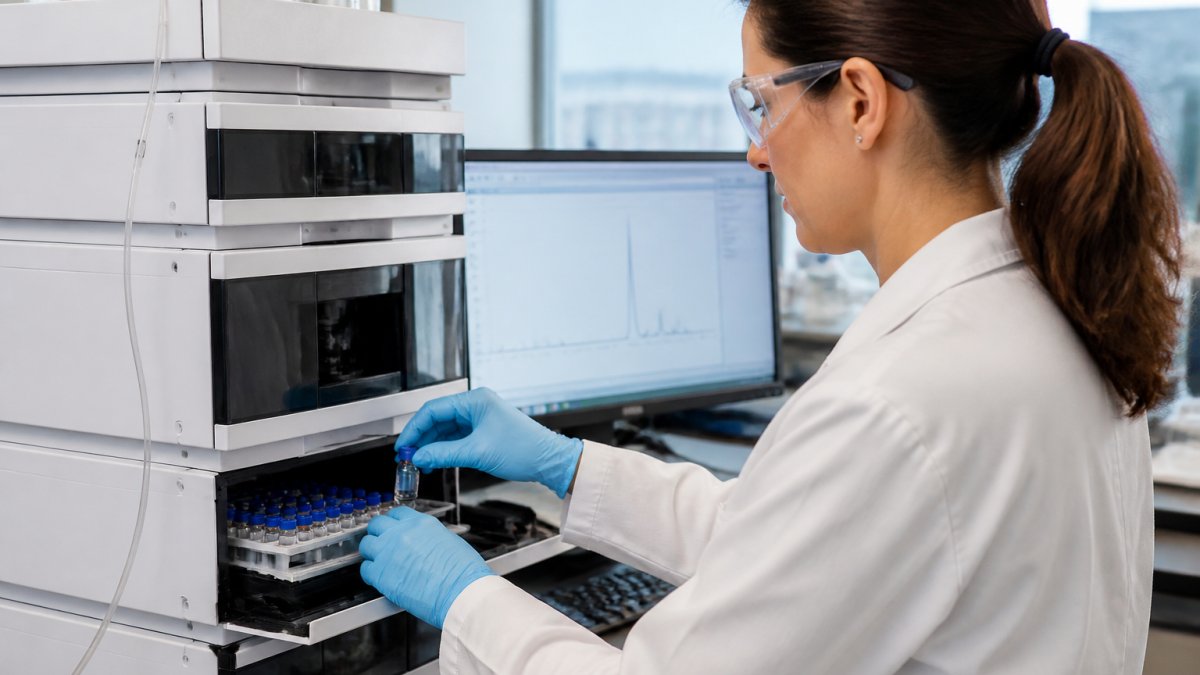
Purity is then reported as area percentage, the area under the primary peak divided by the total area of all peaks. A result of 98% means 98% of the detected UV signal at that wavelength came from the main peak.
That definition is narrower than most people assume, which is where the next section comes in.
Reading an HPLC Chromatogram and Peak Area Percentage
A chromatogram is read by identifying the primary peak, then accounting for everything else. The main peak is your target peptide. Smaller peaks before it are typically truncated sequences or hydrophilic impurities; peaks after it tend to be deletion sequences, oxidation products, or other hydrophobic variants.
Three details change how you should interpret the number:
- Wavelength. Most purity testing runs at 214 nm, which detects the peptide backbone and therefore catches nearly everything. Running at 280 nm detects only aromatic residues and will report a cleaner-looking result.
- Integration settings. Where the software draws the baseline between peaks changes the area percentage. Wide integration inflates purity.
- Gradient and column. A shallow gradient separates more closely related impurities. A fast run can co-elute an impurity with the main peak and hide it.
Purity Percentages and Quality Thresholds for Cell-Based Studies
Purity thresholds for cell culture generally start at 95% and rise to 98% or higher as assay sensitivity increases, but the number alone does not tell you whether a grade is suitable for a cell-based experiment. The threshold reflects how much foreign material the biological system can tolerate before the readout drifts, and it should be set from the assay rather than from a catalog label.
A more useful way to compare grades is to look at what each range actually buys you, what it leaves unresolved, and where it tends to fail.
| Purity Range (area %) | What It Typically Resolves | What It Leaves Unresolved | Reasonable Cell-Culture Use |
|---|---|---|---|
| <90% | Bulk identity and approximate composition | Multiple closely related sequences; unknown impurity profile | Non-biological method development, buffer optimization, instrument calibration |
| 90-95% | Major target peak with visible impurity peaks | Trace truncated or oxidized sequences near the main peak; no endotoxin data | Coarse screening where the expected effect is large and the readout is robust |
| 95-98% | Target peak dominates; most related impurities separated | Low-abundance impurities that co-elute under the run conditions; no sterility or bioburden data | Quantitative assays where the effect size is moderate and the peptide is used at moderate concentration |
| ≥98% | Few detectable impurities under the stated method | Anything the method does not detect: water, counterions, residual solvents, endotoxin, microbial load | Sensitive signaling, viability, or primary-cell work, but only when paired with orthogonal testing |
| Reference-grade, fully characterized | Purity plus identity, counterion, water content, and often endotoxin | Nothing is guaranteed beyond the tests performed; method conditions still govern interpretation | Standards and calibrants that define the accuracy of everything measured against them |
Three trade-offs drive the choice more than the percentage itself:
- Concentration amplifies impurity effects. A 2% impurity in a 1 mg/mL stock is a very different exposure than the same 2% in a 0.01 mg/mL working solution. Practitioners commonly find that low-concentration, high-sensitivity work needs the highest purity available, while high-concentration screening can tolerate a lower grade.
- Effect size sets the floor. If the expected biological effect is small relative to assay noise, impurity-derived activity can dominate the readout. If the effect is large and dose-dependent, a 95% material may be adequate for a first pass.
- The assay's sensitivity to contaminants is not captured by HPLC. Immune-cell, primary-cell, and inflammation-sensitive readouts respond to endotoxin at levels that a purity chromatogram never sees. For those systems, a 99% HPLC result without endotoxin data is not a complete quality picture.
Supplier positions illustrate how loosely "cell culture grade" is applied. The spread between those positions is the reason you should set your own threshold rather than accept a supplier's label.
Matching Purity Grade to Cell-Culture Application
The application, not the peptide, should determine the grade. A few patterns recur across cell-based work:
- Preliminary screening in immortalized lines. A ≥95% grade is often sufficient when the readout is a coarse endpoint such as a colorimetric viability assay and the expected effect is large. The risk is that impurity-derived activity is mistaken for a real hit, so confirm any positive result with a higher-grade lot before committing to follow-up.
- Quantitative dose-response in established lines. ≥98% is the common floor because impurity signal can compete with the target effect across the curve. Pair the purity figure with identity confirmation by mass spectrometry so a sequence error is not misread as a potency difference.
- Sensitive signaling, viability, or primary-cell work. ≥98% plus endotoxin data is the practical minimum. Primary cells and immune cells respond to trace contaminants, and a clean chromatogram does not predict a clean biological response.
- Reference or standard material. Use the highest purity available with full characterization, including counterion and water content, because the standard defines the accuracy of everything measured against it.
A grade is a starting point, not a guarantee. The next section explains why the percentage on a certificate is narrower than most readers assume, and what it leaves out.
What a Peptide Certificate of Analysis Does and Does Not Tell You
A peptide certificate of analysis documents the results of testing performed on a specific lot. It is a record, not a guarantee, and its value depends entirely on what was tested, how it was tested, and by whom.
What a well-constructed certificate typically covers:
- Lot number and the compound identity
- The analytical method used, with conditions
- Purity as area percentage
- Identity confirmation, usually by mass spectrometry
- Storage and handling recommendations
What it frequently does not cover is just as important. Many certificates report purity only. They omit endotoxin, sterility, residual solvents, counterions, and water content. They may not state whether testing was performed in-house or by an independent laboratory. And they rarely explain what the remaining percentage consists of.
That last omission is the one that trips up research teams. A 98% pure peptide is 2% something else, and the certificate usually does not say what.
How Purity Percentage Is Calculated, and What It Excludes
The purity figure on most certificates is an area percentage from a chromatographic run. It is calculated by dividing the area under the target peak by the total area of all detected peaks, then multiplying by 100. A result of 98% means 98% of the detected signal at that wavelength came from the main peak.
That definition is narrower than most readers assume, and it has three consequences worth stating plainly:
- It is method-dependent. The same material can report different purity under different columns, gradients, wavelengths, and integration settings. A shallow gradient separates closely related impurities that a fast run may co-elute with the main peak. Running at 214 nm detects the peptide backbone and catches nearly everything; running at 280 nm detects only aromatic residues and will report a cleaner-looking result. A purity figure quoted without method conditions is not verifiable.
- It excludes anything the method does not detect. Water content, counterions such as trifluoroacetate or acetate, residual solvents from synthesis and purification, and non-UV-absorbing contaminants do not appear as peaks and therefore do not reduce the reported percentage. A peptide can be 98% pure by area percentage and still contain a meaningful mass fraction of counterion or water.
- It does not identify the remaining percentage. The 2% could be truncated sequences, deletion sequences, oxidation products, diastereomers, or unrelated material. The certificate usually reports the total, not the composition.
Reading a Certificate for What Is Absent
Because area percentage answers a narrow question, the most useful skill is reading a certificate for the tests that are missing. A document that reports purity and identity but nothing about endotoxin or bioburden is complete for a chemistry question and incomplete for a cell culture question.
A certificate that supports cell-based work should let you answer all of the following:
- Identity. Is the molecule the right sequence? Mass spectrometry supports this; a purity run alone does not.
- Purity under stated conditions. What method, wavelength, gradient, and column produced the number?
- Counterion and water content. These affect how you weigh and dissolve the material and how you calculate molar concentration.
- Residual solvents. Relevant at higher concentrations and for sensitive cell types.
- Endotoxin, sterility, and bioburden. Separate analytical questions with separate methods; a clean chromatogram does not predict a clean biological response.
- Testing laboratory. Was the work performed in-house or by an independent laboratory? Independent testing strengthens the record because the party reporting the result is not the party selling the material.
Independent testing is one way to close the gaps. At Bluegrass Research, every compound ships with lot-specific, third-party analytical documentation, so the record you receive describes the material in your vial rather than a typical batch.
Peptide Identity Testing by Mass Spectrometry and Orthogonal Confirmation
Peptide identity testing by mass spectrometry confirms that the molecule in the vial is the molecule you ordered. Purity and identity are separate questions, and a sample can score well on one while failing the other.
Mass spectrometry measures the mass-to-charge ratio of the peptide ions and compares the result to the expected molecular weight. If the observed mass matches the theoretical mass within the instrument's tolerance, the identity is supported. This catches sequence errors, missing residues, and unexpected modifications that a purity run alone would miss.
Orthogonal confirmation means using a second, independent method to verify the same claim. For identity, that might pair mass spectrometry with amino acid analysis or sequencing. For purity, it might pair RP-HPLC with a different separation mode. The logic is straightforward: two methods that fail in different ways are harder to fool than one method run twice.
A peptide can be chromatographically clean and still be the wrong sequence.
How Peptide Impurities in Cell Culture Affect Experimental Outcomes
Peptide impurities in cell culture affect outcomes by adding biological activity that is not attributable to your target compound. The effect can be subtle, and it is often mistaken for a real result.
The main impurity classes and their practical consequences:
- Truncated and deletion sequences can retain partial activity at the same receptor, diluting or distorting your dose-response curve.
- Oxidation products change the peptide's behavior and can introduce reactivity you did not intend.
- Residual solvents and counterions from synthesis and purification can affect osmolality and cell health at higher concentrations.
- Endotoxin and microbial contamination trigger inflammatory responses in many cell types, which can swamp a signaling readout entirely.
The last category is the one most often overlooked, because it does not appear on a standard purity certificate at all.
Endotoxin, Sterility, and Bioburden Testing
Endotoxin, sterility, and bioburden testing address whether a peptide is safe for a living system, not whether it is chemically pure. These are separate analytical questions with separate methods.
Endotoxin is a component of certain bacterial cell walls and produces a strong inflammatory response in many cell types. It is measured with a Limulus amebocyte lysate assay, and results are reported in endotoxin units per milligram or per milliliter. Sterility testing looks for viable microorganisms. Bioburden quantifies the microbial load before sterilization.
For cell-based work, the practical rule is that a peptide can be 99% pure by HPLC and still carry enough endotoxin to ruin a viability assay. If your readout involves immune cells, primary cells, or any inflammation-sensitive pathway, request endotoxin data alongside the purity figure. If it is not available, that is information too.
Lot-to-Lot Consistency, Reference Standards, and Documentation
Lot-to-lot consistency is the property that lets you compare results across experiments run months apart. It is measured by testing each lot against the same specifications and, where possible, against a retained reference standard.
A reference standard is a well-characterized material used as a benchmark. When a new lot is tested, its chromatogram and mass spectrum are compared to the standard. Consistent retention time, peak shape, and mass confirm that the new lot behaves like the old one.
Documentation is what makes this verifiable. Each lot should carry:
- A unique lot number traceable to its certificate
- The analytical results for that specific lot, not a representative example
- The testing laboratory and method conditions
- Storage conditions and any stability data
Independent testing strengthens the record.
At Bluegrass Research, every compound ships with lot-specific, third-party analytical documentation, so the record you receive describes the material in your vial rather than a typical batch. Storage support and discreet shipping are part of the same commitment to compound integrity.
Conclusion
The hard part of peptide purity is not finding a number; it is knowing what the number leaves out. Purity percentage, identity confirmation, endotoxin data, and lot documentation each answer a different question, and a cell culture study needs all of them.
Bluegrass Research supplies research-grade peptides with lot-specific certificates of analysis, third-party testing, and documented verification records, along with secure storage support and discreet shipping. Get started with Bluegrass Research and build your next study on material you can actually defend.
Frequently Asked Questions
What peptide purity level is appropriate for cell culture studies?
For most cell culture work, a purity of at least 98% is a practical starting point because lower-purity material carries more impurities that can alter cell responses. Some sensitive assays, such as dose-response studies on metabolic peptides, benefit from 99% or higher. Purity alone is not the full picture: identity confirmation and low endotoxin matter as much as the percentage, so review the full certificate of analysis before committing a lot to a study.
Is 95% peptide purity enough for cell culture experiments?
It depends on the assay. A 95% purity level leaves up to 5% of the sample as other material, which may include deletion sequences, truncated peptides, or residual solvents. For qualitative work that tolerates variability, 95% can be acceptable. For quantitative cell-based studies where small differences in concentration change the outcome, higher purity reduces the risk that an impurity, not the peptide, drives the result. Match the threshold to how sensitive your readout is.
How is peptide purity measured using HPLC?
Reverse-phase HPLC separates the components of a peptide sample on a column, and each component elutes at a different time. The detector records a chromatogram, and the area under the primary peak is divided by the total peak area to give an area percentage. That number is the reported purity. It reflects what the method can detect, so a stated percentage always depends on the chromatographic conditions and wavelength used for the analysis.
What does a peptide certificate of analysis say about purity?
A certificate of analysis ties a specific lot number to its analytical results. It should list the purity percentage from HPLC, the identity confirmation method and result, and often the appearance, water content, and storage guidance. When you review a peptide certificate of analysis, check that the lot number matches the vial and that the methods are named. A COA without lot-specific data is hard to defend if your results are scrutinized later.
What impurities can affect cell culture results?
Common impurities include deletion and truncated sequences from synthesis, residual solvents, counterions, and water content. Endotoxin and microbial bioburden matter for cell culture because they can trigger inflammatory responses in cells even at low levels. Because HPLC purity does not detect all of these, peptide impurities in cell culture are best controlled with complementary testing: mass spectrometry for identity, plus endotoxin and sterility checks when the application requires them.