 ultimate-guide
Metabolic Peptide Study Purity Requirements: 2026 Guide
Table of Contents
- Why Purity Requirements Decide Metabolic Peptide Study Outcomes
- Acceptable Purity Levels for Metabolic Research
- HPLC vs Mass Spectrometry for Peptide Verification
- How to Spot Fraudulent Peptide Certificates of Analysis
- Reading Chromatograms and Mass Spec Data Without a Chemistry Degree
- Storage, Stability, and Batch Variability in Metabolic Peptide Purity
- Standardizing Purity Reporting Across Vendors and Labs
- Conclusion
- Frequently Asked Questions
Last Updated: September 26, 2026
Why Purity Requirements Decide Metabolic Peptide Study Outcomes
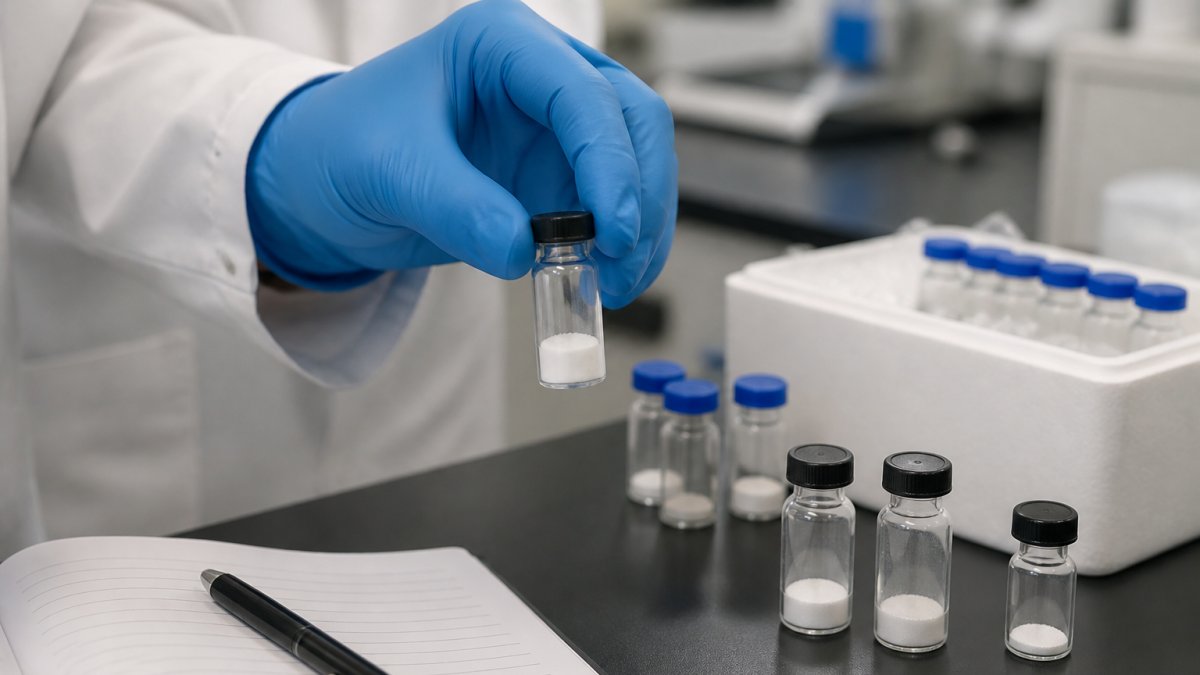
Metabolic peptide study purity requirements determine whether your experimental results hold up to scrutiny or collapse under peer review. At Bluegrass Research, we supply research-grade peptides verified through lot-specific, third-party analytical documentation. A peptide that is 85% pure introduces unknown variables into your assay; a peptide that is 98% pure with a complete Certificate of Analysis gives you a defensible foundation. The difference isn't academic. It's the line between publishable data and wasted months.
Acceptable Purity Levels for Metabolic Research
Acceptable purity levels for metabolic research typically start at 95% for exploratory work and climb to 98% or higher for studies intended for publication or regulatory submission. The threshold you choose depends on your assay sensitivity and the peptide's role in your experimental design.
HPLC vs Mass Spectrometry for Peptide Verification
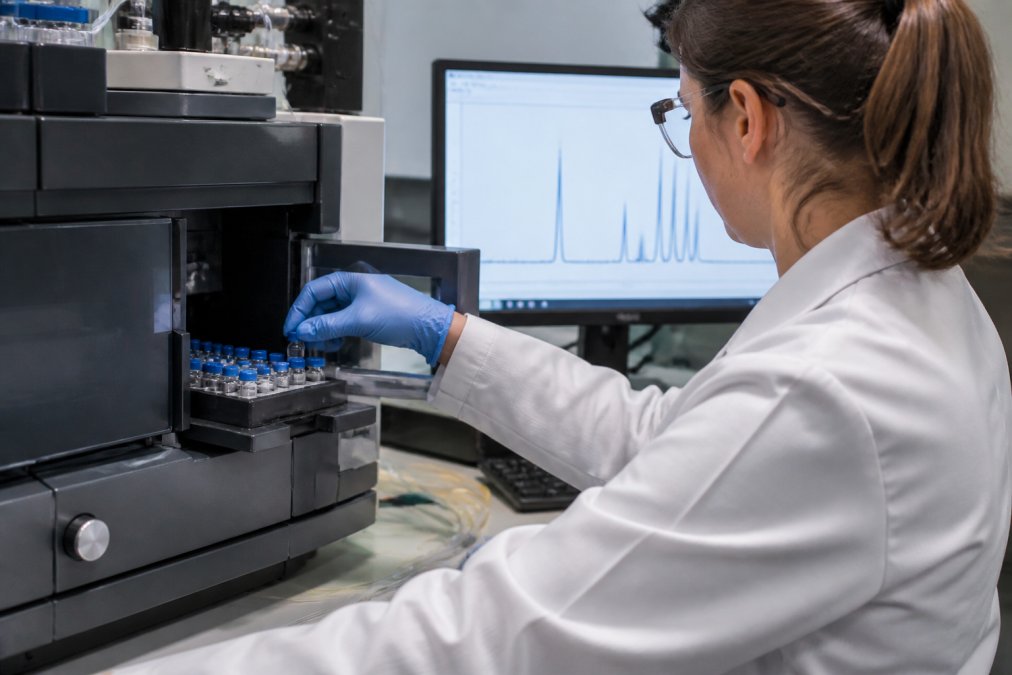
HPLC and mass spectrometry serve complementary roles in peptide verification. HPLC separates and quantifies components based on hydrophobicity, while mass spectrometry confirms molecular identity by measuring mass-to-charge ratios.
What Each Method Proves (and What It Misses)
HPLC proves relative abundance of components in your sample. It cannot confirm that the main peak is your target peptide.
How to Spot Fraudulent Peptide Certificates of Analysis
Fraudulent peptide Certificates of Analysis share recognizable patterns: generic formatting, missing lot numbers, absent chromatograms, and purity claims without supporting raw data. A legitimate COA ties directly to your specific batch.
Red flags include:
- No lot or batch number linking the COA to your order
- Purity percentages without accompanying HPLC traces
- Missing mass spectrometry data or molecular weight confirmation
- No third-party laboratory identification
- Identical COAs across different peptides
Reading Chromatograms and Mass Spec Data Without a Chemistry Degree
Most guides tell you to "check the chromatogram" but never explain what you are actually looking at. This section bridges that gap with a practical, non-chemist's walkthrough of the two data types you will encounter on a peptide Certificate of Analysis (CoA): the HPLC chromatogram and the mass spectrum.
How to Read an HPLC Chromatogram
An HPLC chromatogram plots retention time on the x-axis (usually in minutes) against absorbance on the y-axis (measured in milli-absorbance units, mAU). The detector is typically set to 214 nm for peptides because the amide backbone absorbs strongly at that wavelength. Some labs also report at 220 nm or 280 nm; 280 nm only detects aromatic residues (tryptophan, tyrosine, phenylalanine), so a peptide lacking those residues may show a misleadingly low or absent peak at 280 nm.
What to look for:
- Main peak shape: A symmetrical, sharp peak suggests a single dominant species. A broad or split peak indicates co-eluting impurities or conformational heterogeneity.
- Baseline: A flat, stable baseline means clean separation. A rising or noisy baseline can mask small impurity peaks and inflate the reported purity percentage.
- Impurity peaks: Small peaks before the main peak (earlier retention time) are often truncated sequences or deletion peptides. Peaks after the main peak are frequently oxidation products, deamidation variants, or diastereomers.
- Purity percentage: This is the area of the main peak divided by the total area of all peaks, multiplied by 100. A reported 98% purity means 2% of the total UV-absorbing material is something else.
How to Read a Mass Spectrum
A mass spectrum plots mass-to-charge ratio (m/z) on the x-axis against relative intensity on the y-axis. For peptides, you will typically see a series of peaks corresponding to different charge states (e.g., [M+2H]2+, [M+3H]3+) rather than a single peak at the molecular weight. This is normal and expected.
Common red flags in mass spectra:
- Extra peaks at +16 Da: Oxidation of methionine or tryptophan residues.
- Extra peaks at +1 Da: Deamidation of asparagine or glutamine.
- Peaks at roughly half the expected mass: Could indicate a deletion sequence or a synthesis failure.
- No dominant peak matching the expected mass: The material may be the wrong peptide entirely.
A Practical Checklist for Non-Experts
When you receive a CoA, verify these five items before trusting the purity claim:
- Detection wavelength is stated (214 nm is standard for peptides).
- Chromatogram shows a single dominant peak with a flat baseline.
- Mass spectrum shows a dominant peak consistent with the theoretical molecular weight.
- Lot number on the CoA matches the lot number on your vial.
- Third-party laboratory is identified and independent of the vendor.
| Verification Method | What It Confirms | What It Misses | Best For |
|---|---|---|---|
| HPLC | Purity percentage, component separation | Sequence identity | Quantifying impurities |
| Mass Spectrometry | Molecular weight, sequence | Purity percentage | Identity verification |
| Both Combined | Full characterization | Nothing significant | Publication-grade studies |
Storage, Stability, and Batch Variability in Metabolic Peptide Purity
Most purity discussions end at the Certificate of Analysis. That is a mistake. Purity is not a fixed property; it degrades over time depending on how the peptide is stored, handled, and reconstituted. This section covers the two variables competitors consistently overlook: storage-induced degradation and batch-to-batch variability.
How Storage Conditions Degrade Purity
Lyophilized (freeze-dried) peptides are relatively stable when stored correctly. The key variables are temperature, moisture, and oxygen.
- -20°C: Suitable for short-term storage (weeks to a few months) of most lyophilized peptides.
- -80°C: Recommended for long-term storage (months to years) of lyophilized peptides, especially those prone to oxidation or deamidation.
- Desiccant: Lyophilized peptides are hygroscopic. Exposure to moisture accelerates hydrolysis and aggregation. Store with desiccant and allow vials to equilibrate to room temperature before opening to prevent condensation.
- Reconstituted peptides: Once dissolved, peptides are far less stable. Most reconstituted peptides should be stored at 4°C for short-term use (days to weeks) and at -20°C or -80°C for longer periods, ideally aliquoted to avoid repeated freeze-thaw cycles.
Common degradation pathways include:
- Hydrolysis: Cleavage of peptide bonds, especially at aspartic acid residues.
- Oxidation: Modification of methionine, cysteine, or tryptophan residues, often adding 16 Da to the molecular weight.
- Deamidation: Conversion of asparagine or glutamine to aspartic acid or glutamic acid, adding approximately 1 Da.
- Aggregation: Non-covalent clustering of peptide molecules, which can appear as a broad peak or precipitate.
Batch-to-Batch Variability: The Hidden Variable
Even reputable vendors produce lots with slightly different impurity profiles. This is inherent to solid-phase peptide synthesis (SPPS), where coupling efficiency, reagent quality, and purification conditions vary from batch to batch. The result is that two lots of the same peptide, both labeled 98% pure, may have different impurity profiles.
How to manage batch variability:
- Order enough for the full study: If possible, purchase a single lot large enough to complete your experiments.
- Record lot numbers: Document the lot number of every peptide you use in every experiment.
- Run a bridging study: If you must switch lots, run a side-by-side comparison in your assay to confirm equivalent activity.
- Request lot-specific CoAs: Generic documentation defeats the purpose of quality control.
A Note on Shipping and Handling
Temperature excursions during shipping can degrade peptides. Lyophilized peptides are generally stable at ambient temperatures for short periods, but reconstituted peptides are not. If you receive a peptide that was shipped without temperature control, inspect the vial for discoloration or precipitate and consider running an in-house purity check before use.
Standardizing Purity Reporting Across Vendors and Labs
Standardization of reporting remains inconsistent across the peptide industry. Some vendors report purity by HPLC area percentage; others use different methods that yield different numbers.
Conclusion
Metabolic peptide study purity requirements aren't bureaucratic hurdles; they're the foundation of reproducible science. The documentation you accept, the verification methods you require, and the storage protocols you follow determine whether your metabolic research produces defensible results.
Frequently Asked Questions
What is the acceptable purity for peptides used in metabolic research?
Most metabolic peptide studies require 95% or higher purity, with 98% or above preferred for sensitive assays. The exact threshold depends on your study design: cell-based metabolic assays and in vivo work typically demand 98%+, while exploratory screening may tolerate 95%. Anything below 95% introduces enough impurities to skew dose-response curves and confound reproducibility. Always match the purity threshold to the sensitivity of your analytical endpoints and the specific metabolic peptide under study.
How can researchers identify fraudulent certificates of analysis?
Check for three red flags: a COA that lists only a purity percentage without chromatogram images or method details, a lot number that does not match the vial label, and testing attributed to a lab with no verifiable accreditation. Legitimate COAs include the HPLC method, column type, wavelength, retention time, and a mass spectrometry confirmation of molecular weight. Request lot-specific documentation, not a generic sample COA. If the vendor cannot provide the raw chromatogram on request, treat the documentation as unverified.
Does peptide purity impact the reproducibility of metabolic research?
Yes, directly. Impurities such as truncated sequences, deletion peptides, and residual solvents can alter receptor binding, metabolic stability in plasma matrices, and apparent bioavailability. A study run at 92% purity may show different dose-response curves than the same peptide at 98%, making cross-study comparisons unreliable. Batch-to-batch variability compounds this: if purity drifts by even 2-3% between lots, your control and treatment groups may not be comparable. Documented, lot-specific purity is the foundation of reproducible metabolic data.
How are peptides tested for purity and identity?
Two methods work together. Reverse-phase HPLC separates the peptide from impurities and quantifies purity by UV absorbance at 214 nm, giving the percentage figure on a COA. Mass spectrometry confirms molecular weight and verifies the peptide sequence matches the intended structure. Neither alone is sufficient: HPLC can show 98% purity for the wrong peptide, and mass spec confirms identity but not impurity levels. A defensible COA reports both, plus the analytical conditions used, so another lab can reproduce the result.